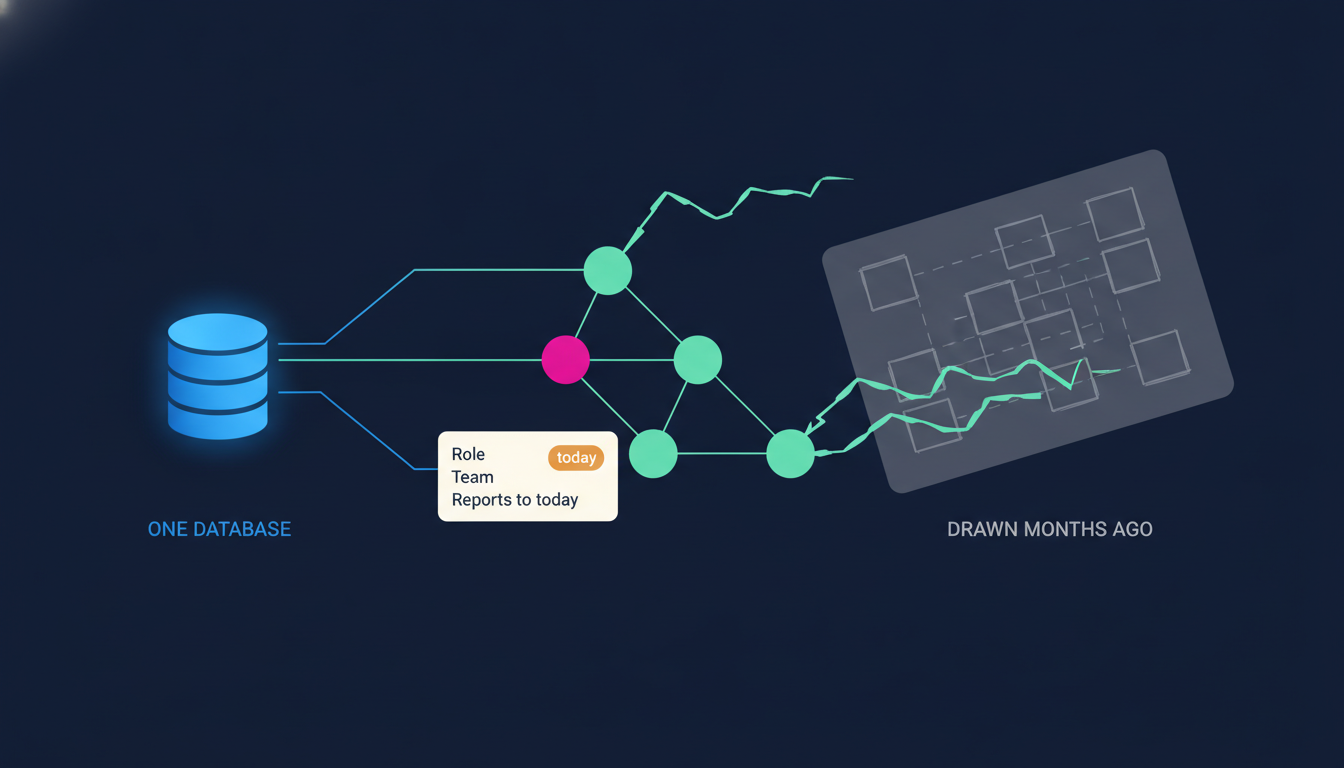
Ask to see your organization and you get a slide.
Somebody drew it for a board meeting. They spent an afternoon lining up boxes, exported it, and dropped it into the deck. It looked clean in the room. It was wrong within weeks. Someone left, someone got promoted, a team split in two, and nobody touched the slide because nobody owns the slide.
That is what most CEOs mean when they say "the org chart": a picture of the company as it was, used to make decisions about the company as it is.
I ran on one for years. I had the deck, I had my gut, and I told myself that was enough. It was not, and if you are honest, it is not enough for you either.
So here is the position I am taking today. The org chart should not be a document at all. Not a slide, not a PDF, not a drawing. If it is a document, it is already lying to you. It should be a view of the data your company runs on, so it cannot drift from the truth because it is the truth. And it should sit next to a steady way of hearing from the people inside those boxes, because structure is only half of what you need to see.
The three questions a slide cannot answer
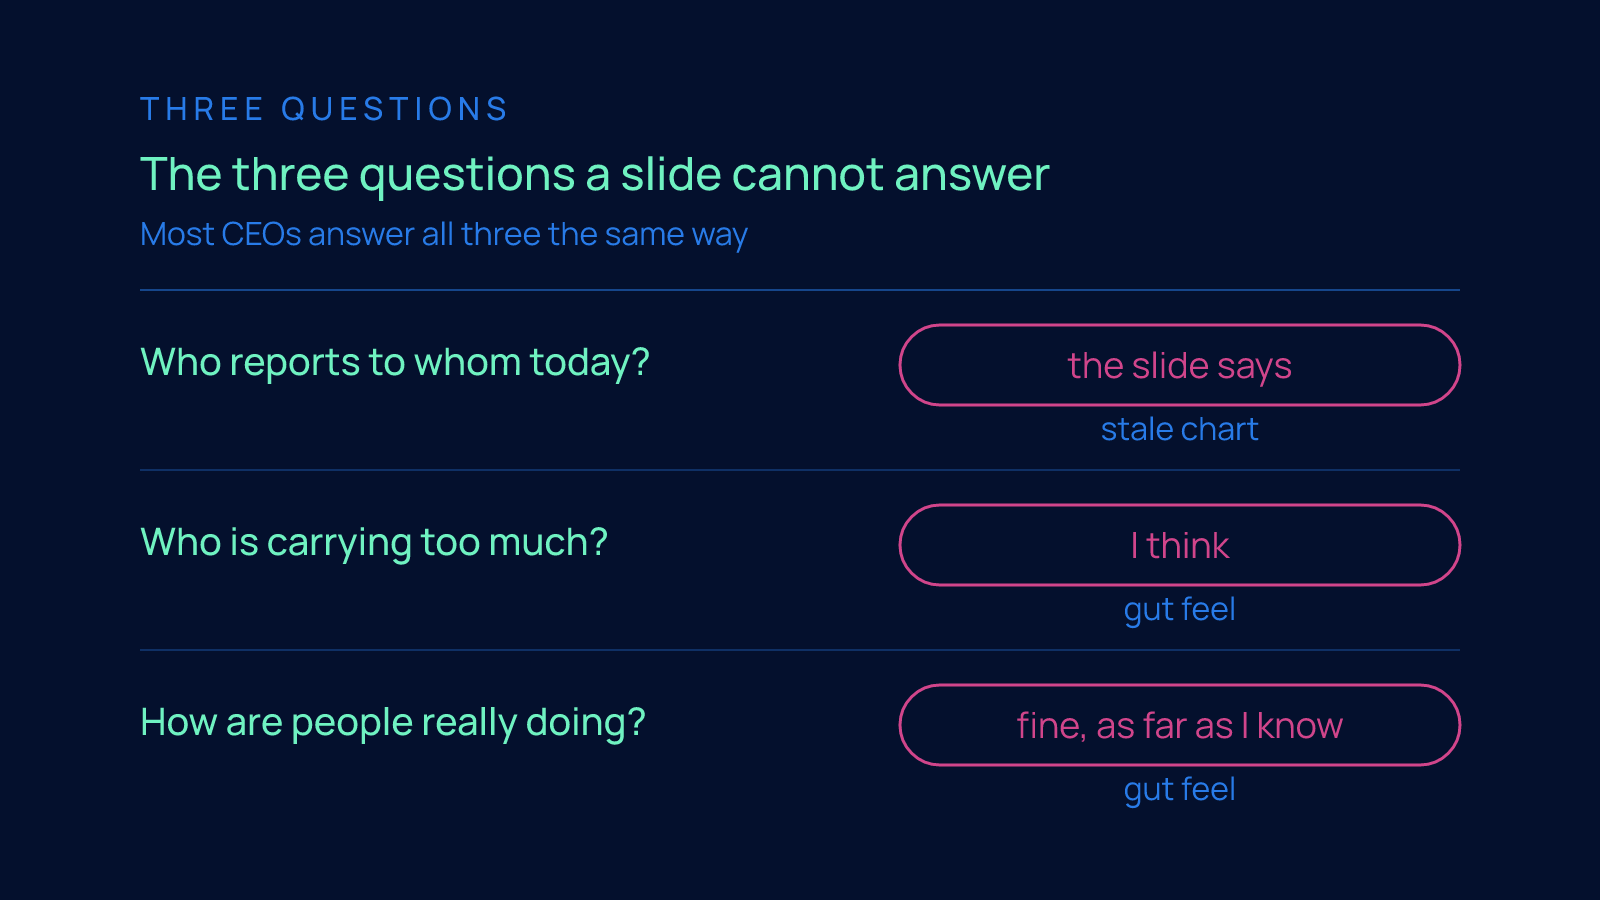
When a CEO says "show me the organization," there are three questions underneath the request. The slide answers none of them.
Who reports to whom today? Not at the last board meeting. Today. Reporting lines move more than anyone admits. A manager leaves and their people get parked under someone temporarily. A new person starts under the wrong manager because the form was filled in before the decision was final. A founder keeps a direct report long after they said they would hand them over. The slide shows the plan. You need the fact.
Who is carrying too much? Load is invisible on a chart. Two boxes at the same level can hide one person with a sane week and one person doing two jobs. The one doing two jobs is usually the one you cannot afford to lose, and the chart gives you no way to notice until they resign.
How are people really doing? Underneath structure and load is the question you actually care about: how are they, not the version said in meetings. The answer never shows up in a box. It shows up in whether anyone tells you the truth.
Most CEOs answer all three the same way: a stale chart for the first, gut feel for the second and third. I did too. Gut feel is not nothing. It is just late. By the time your gut tells you someone is drowning, they have been drowning for a while.
What Edmondson found, and why it matters here
Amy Edmondson's research at Harvard named what separates the best teams: psychological safety, the belief that you can speak up, flag a problem or admit a miss without it being held against you.
Amy Edmondson, at Harvard, named the thing that separates the best teams from the rest. She called it psychological safety. The plain-language version: the belief that you can speak up, flag a problem, or admit a miss without it being held against you.
Her research found that teams with it learn faster and perform better. The reason is not mysterious. Problems surface while they are still small. Someone says "I think this is broken" on the day it breaks, instead of weeks later when it is a crisis and the only reason it came out is that it could no longer be hidden.
That is the whole game for a CEO trying to see the organization as it really is. The chart tells you where the people are. Safety decides whether the truth travels up from where they are to where you are.
Here is the hard part: you cannot demand it. A CEO who announces "we have psychological safety here" has usually just reduced it. Safety is earned slowly and lost in one bad meeting.
But you can measure whether the truth is reaching you. And you can keep the structure that carries the truth honest, so that when someone does speak up, it lands with the right person, and that person is actually the one who can act.
That is the pairing: a chart that tells the truth and a rhythm that lets people tell it too.
The turn: a chart that is a view, not a document
In 8 Edges the org chart is not a slide. It is drawn live from the same database as everything else, so when a reporting line changes the chart changes, because they are the same fact.
Back to the slide, because the fix is simpler than it sounds.
The reason the slide goes stale is that it is a copy. Somebody looked at reality, drew what they saw, and saved the drawing. From that moment the drawing and reality are two different things, and only one of them keeps changing.
The fix is to stop copying. Draw the chart live from the same database the rest of the company runs on. Then when a reporting line changes, the chart changes, not because someone remembered to update it, but because the reporting line and the chart are the same fact stored once.
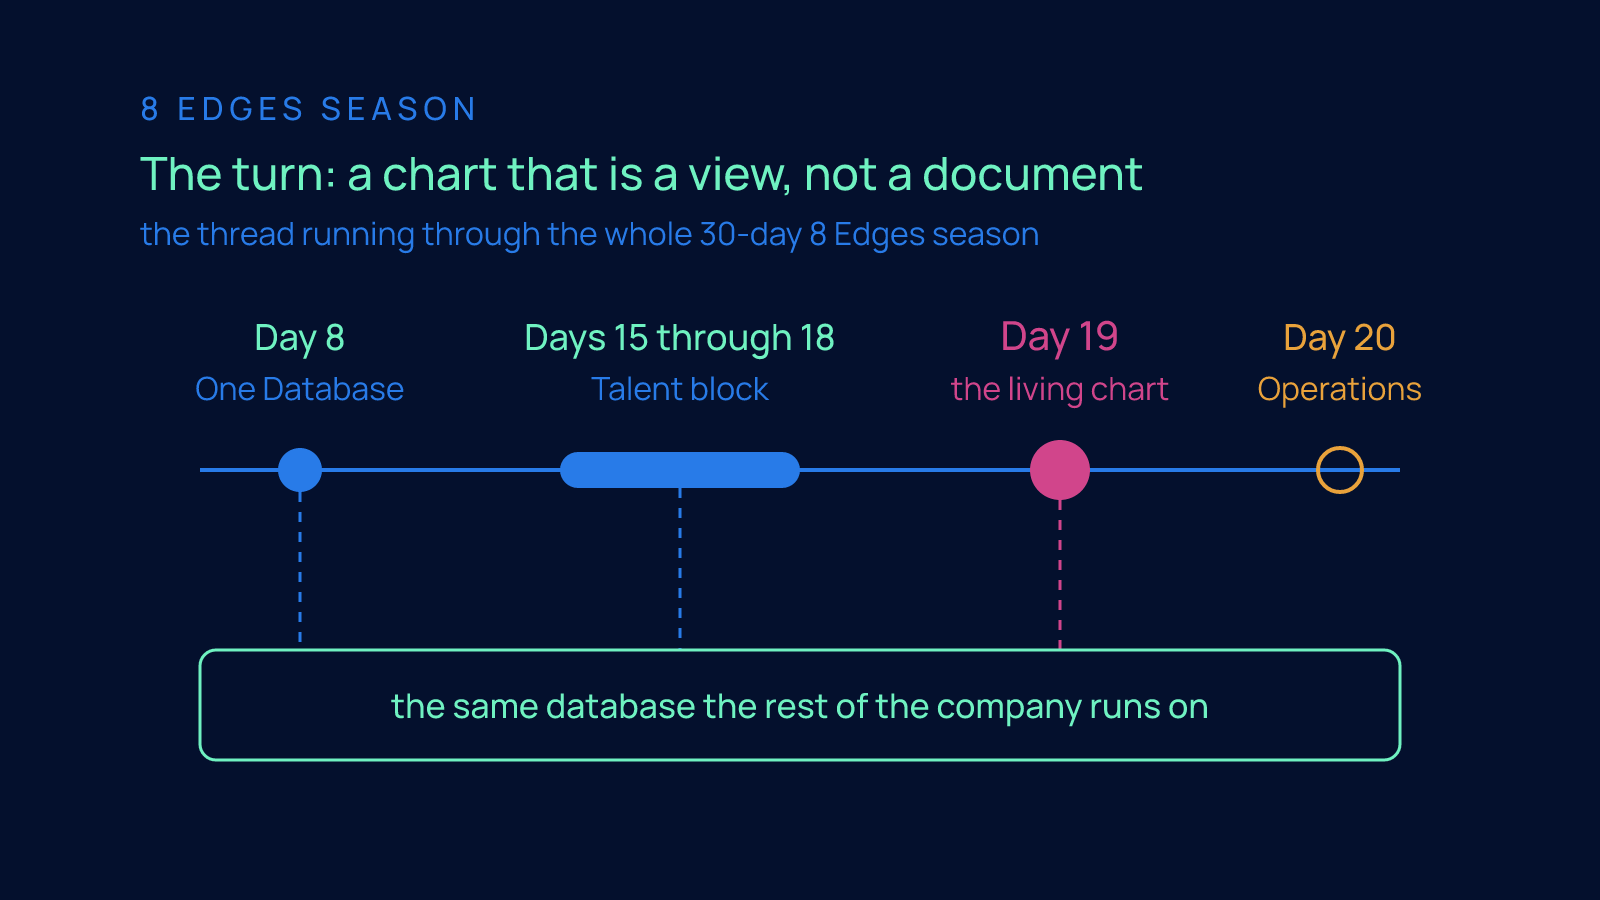
This is the thread running through the whole 30-day 8 Edges season. Day 8 was One Database: the single source of truth every other edge draws from. Days 15 through 18 worked the Talent block person by person, from the resume pile, through the human override on screening, to onboarding and the prepared 1-on-1. Every one of those wrote into the same place. Day 19 zooms all the way out: if all of that lives in one database, then the shape of the organization is already in there. You do not need to draw it. You need to look at it.
A chart drawn this way is right by construction. Nobody has to maintain it. Nobody can quietly let it rot. It is as current as the last change anyone made, which is the only standard that matters.
Walking the living chart
In the Day 19 film I walk this as it runs in Edge8's own Company OS. Company OS is our name for the one database our company runs on, the same system that holds our deals, our workflows, our people, and our content. The org chart you see is not a screenshot and not a mockup. It is us, drawn live.
Click any person and the real structure around them is there: their role, their team, who they report to today. Not who they reported to when the deck was built. Today. Change a reporting line anywhere in the system and the chart redraws, because there is nothing to sync. It was never separate.
The only other screen in the film is the dashboard assistant. You ask it a plain-English question about the team and it answers from the same data. That matters for the "who is carrying too much" question, because load is not something you want to reconstruct by hand across a pile of tools. You want to ask, and get an answer that reflects the company as it is this morning.
That is the structure half. The chart is honest because it cannot be anything else.
The listening rhythm
The other half is not on camera, so let me describe it the way the script does.
Edge8 listens on a rhythm. Short surveys, asked consistently, in a channel built for honest answers. Not a once-a-year engagement survey with a long list of questions that everyone fills in defensively. A short, steady set of questions, asked the same way each time, in a place where people know the point is to hear the truth and not to grade them.
Consistency is what makes it work. One survey tells you how people felt on a Tuesday. The same questions asked on a rhythm tell you which way things are moving, and that is what a CEO actually needs: not a snapshot of morale, but the direction of it, team by team, before it shows up as attrition.
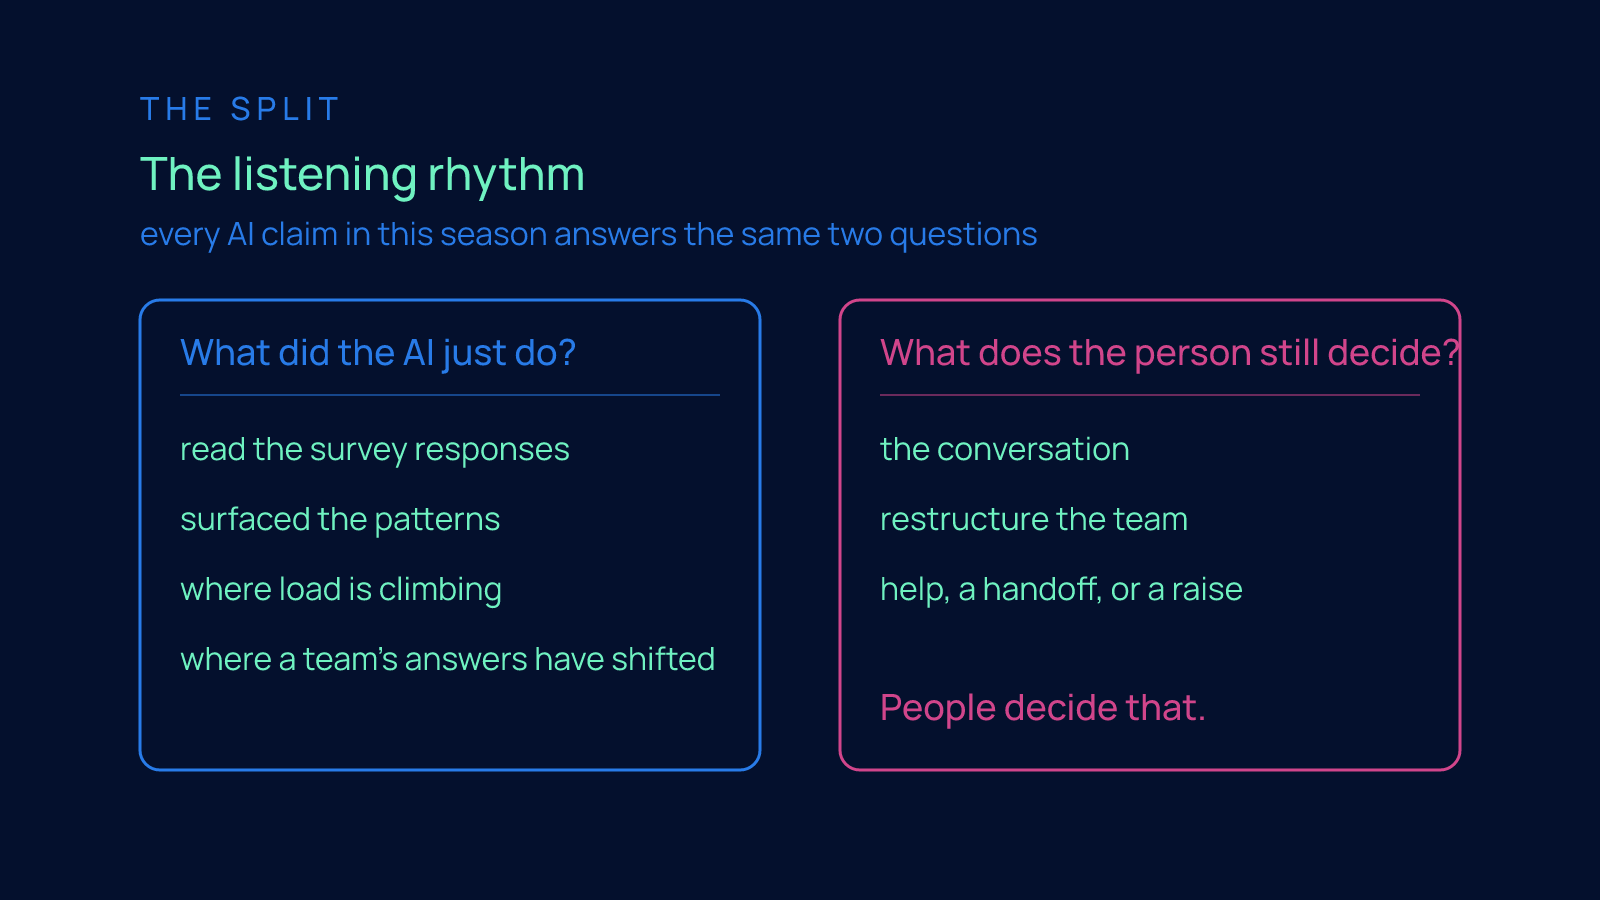
Then the split, which I want to be precise about, because every AI claim in this season answers the same two questions.
What did the AI just do? It read the survey responses and surfaced the patterns. Across a company, the raw answers are too many for one person to read closely and consistently, and the signal is in the pattern, not the individual reply. The AI does the reading. It points at where load is climbing, where a team's answers have shifted, where the same concern is showing up from several directions.
What does the person still decide? Everything that matters. The humans read the chart, look at the pattern the AI surfaced, and decide what to do about it. The AI does not have the conversation. It does not restructure the team. It does not decide whether the person doing two jobs needs help, a handoff, or a raise. People decide that. The AI just made sure they were deciding with the truth in front of them instead of a guess.
Why this is a talent edge and not a reporting feature
An org chart that tells the truth and a rhythm that lets people tell it too is higher performing talent.
It would be easy to file this under dashboards. That misses the point.
The reason the Talent block ends here is that an organization that can see itself clearly keeps better people and gets more out of them. The person carrying too much gets noticed before they burn out. The team whose answers are drifting gets attention before the drift becomes a resignation. The new manager who inherited a structure nobody explained can click a box and see what they actually own.
And because the surveys are asked in a channel built for honest answers, people learn that speaking up changes something. That is how safety is earned: not by announcing it, but by acting visibly on what people tell you. The rhythm measures whether the truth is reaching you. Acting on it is what makes people keep telling it.
An org chart that tells the truth and a rhythm that lets people tell it too is higher performing talent. Not because of the software. Because the CEO is finally making people decisions from the company as it is, not the company as it was drawn.
What to do next
Watch the Day 19 film. It is short, and the living chart is easier to understand when you see it move than when I describe it.
Then look at your own org chart and ask the three questions honestly: who reports to whom today, who is carrying too much, and how are people really doing. If the answers are "the slide says," "I think," and "fine, as far as I know," you are running on a stale chart and gut feel. Most of us were. It is fixable.
If you want to see the living org chart and the listening rhythm running on your own company data, reply to this and ask for a demo.
Tomorrow is Day 20, and we change offices. Operations: the honest cost center, and why the goal is to make it small.
FAQ
How do I see my organization as it really is, who reports to whom today and who is carrying too much, when the only org chart I have was drawn for a board meeting months ago and is already wrong?
Stop treating the org chart as a document and make it a view of the one database your company already runs on, so a reporting line and the chart are the same fact stored once and the chart cannot drift. Then pair that structure with a steady listening rhythm of short surveys asked the same way each time, so load and morale reach you while problems are still small. Together those answer the three questions a slide never can: who reports to whom today, who is carrying too much, and how people are really doing.
Why does my org chart go out of date so fast, and how do I keep it current without someone having to maintain it?
A slide goes stale because it is a copy: someone drew what they saw, and from that moment the drawing and reality are two different things and only one of them keeps changing. The fix is to draw the chart live from the single database the rest of the company runs on, which is the thread running through the whole 30-day 8 Edges season, starting with Day 8 on one database. A chart drawn that way is right by construction, because when a reporting line changes anywhere in the system the chart redraws and nobody has to remember to update it.
How do I spot which person on my team is carrying too much before they burn out or resign?
Load is invisible on a chart: two boxes at the same level can hide one person with a sane week and one person doing two jobs, and the one doing two jobs is usually the one you cannot afford to lose. Instead of reconstructing load by hand across a pile of tools, ask a plain-English question of a dashboard assistant that answers from the same live data the org chart is drawn from. Most CEOs answer this question with gut feel, and gut feel is late; by the time it tells you someone is drowning, they have been drowning for a while.
How do I get my employees to tell me the truth about how they are really doing instead of saying everything is fine?
Amy Edmondson at Harvard found that psychological safety, the belief that you can speak up or admit a miss without it being held against you, is what lets problems surface while they are still small, and she found teams with it learn faster and perform better. You cannot demand it, and it is earned slowly and lost in one bad meeting, but you can measure whether the truth is reaching you with short surveys asked consistently in a channel built for honest answers. One survey only tells you how people felt on a Tuesday; the same questions on a rhythm tell you which direction each team is moving, and acting visibly on what people say is what keeps them telling you.
What should AI do with employee survey responses, and what decisions should I still make myself?
Every AI claim should answer the same two questions: what did the AI just do, and what does the person still decide. The AI reads the survey responses and surfaces the patterns, because across a company the raw answers are too many for one person to read closely and the signal is in the pattern, not the individual reply. The people decide everything that matters, including whether the person doing two jobs needs help, a handoff, or a raise; the AI does not have the conversation or restructure the team.